Line Intensity Profile Comparisons
The temul.signal_plotting module allows one to draw line
intensity profiles over images. The
:py:func`temul.signal_plotting.compare_images_line_profile_one_image` can be used to
draw two line profiles on one image for comparison. In future we hope to expand
this function to allow for multiple line profiles on one image. The
temul.signal_plotting.compare_images_line_profile_two_images()
function allows you to draw a line
profile on an image, and apply that same profile to another image (of the same shape).
This can be useful for comparing subsequent images in series or comparing experimental
and simulated images.
Check out the examples below for each comparison method.
Load the Example Images
Here we load some dummy data using a variation of Atomap’s
temul.dummy_data.get_simple_cubic_signal() function.
>>> from temul.dummy_data import get_simple_cubic_signal
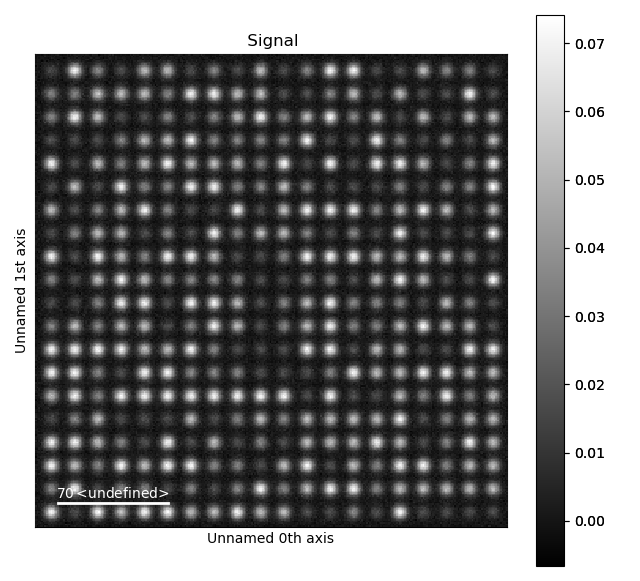
>>> imageA = get_simple_cubic_signal(image_noise=True, amplitude=[1, 5])
>>> imageA.plot()
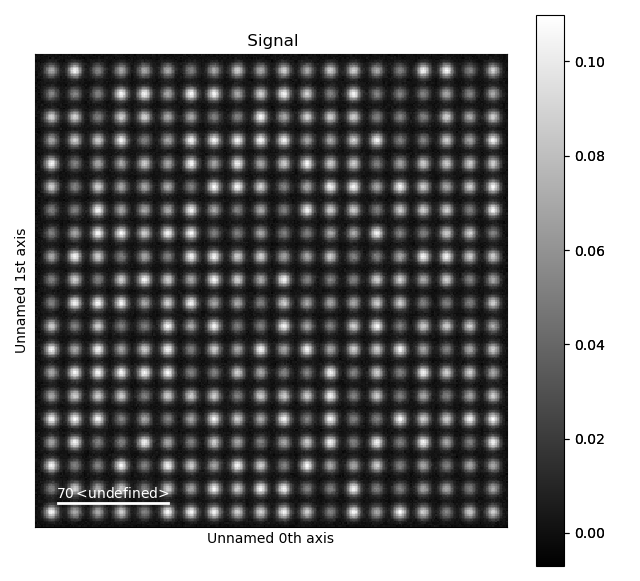
>>> imageB = get_simple_cubic_signal(image_noise=True, amplitude=[3, 7])
>>> imageB.plot()
>>> sampling, units = 0.1, 'nm'
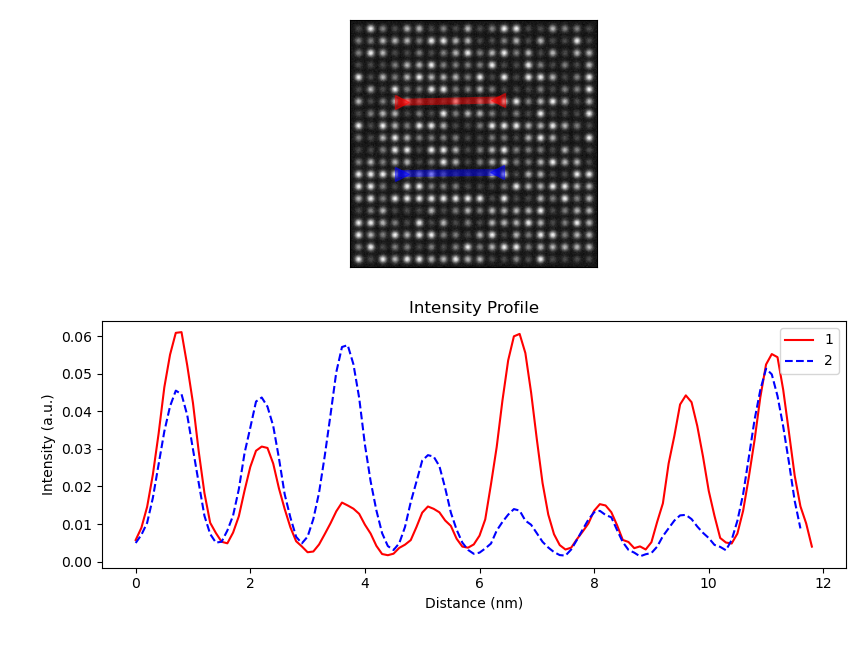
Compare two Line Profiles in one Image
As with the Masked FFT and iFFT tutorial, we can
choose points on the image. This time we use
temul.topotem.fft_mapping.choose_points_on_image().
We need to choose four points for the
temul.signal_plotting.compare_images_line_profile_one_image()
function, as it draws two line profiles over one image.
>>> import temul.api as tml
>>> line_profile_positions = tml.choose_points_on_image(imageA)
>>> line_profile_positions
[[61.75132848177407, 99.25182885155715],
 [178.97030854763057, 96.60281235289372],
 [61.75132848177407, 186.0071191827843],
 [177.64580029829887, 184.6826109334526]]
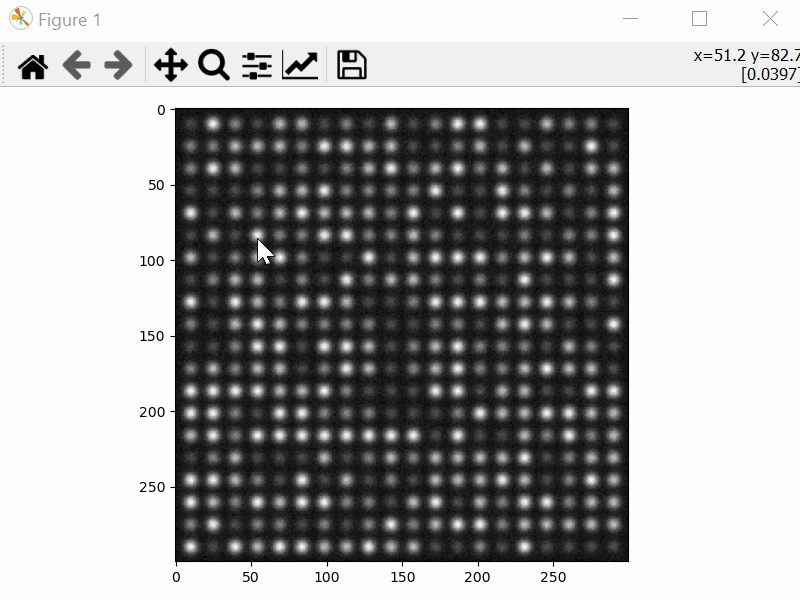
Now run the comparison function to display the two line intensity profiles.
>>> tml.compare_images_line_profile_one_image(
...             imageA, line_profile_positions, linewidth=5,
...             sampling=sampling, units=units, arrow='h', linetrace=1)
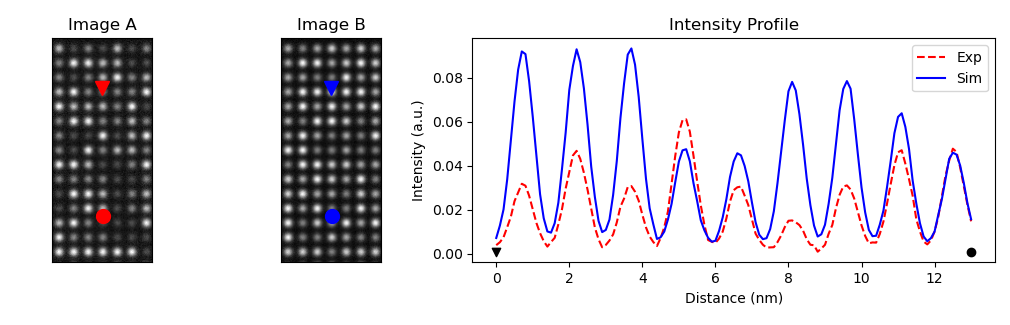
Compare two Images with Line Profile
Using temul.topotem.fft_mapping.choose_points_on_image(),
we now choose two points on one image.
Then, we plot this line intensity profile over the same position in two images.
>>> line_profile_positions = tml.choose_points_on_image(imageA)
>>> line_profile_positions
[[127.31448682369383, 46.93375300295452],
 [127.97674094835968, 176.7355614374623]]
>>> import numpy as np
>>> tml.compare_images_line_profile_two_images(imageA, imageB,
...             line_profile_positions, linewidth=5, reduce_func=np.mean,
...             sampling=sampling, units=units, crop_offset=50,
...             imageA_title="Image A", imageB_title="Image B")