Plot Lattice Structure Maps
The temul.topotem.polarisation module allows one to easily visualise various
lattice structure characteristics, such as strain, rotation of atoms along atom
planes, and the c/a ratio in an atomic resolution image. In this tutorial,
we will use a dummy dataset to show the different ways each map can be created.
In future, tutorials on published experimental data will also be available.
Prepare and Plot the dummy dataset
>>> import temul.api as tml
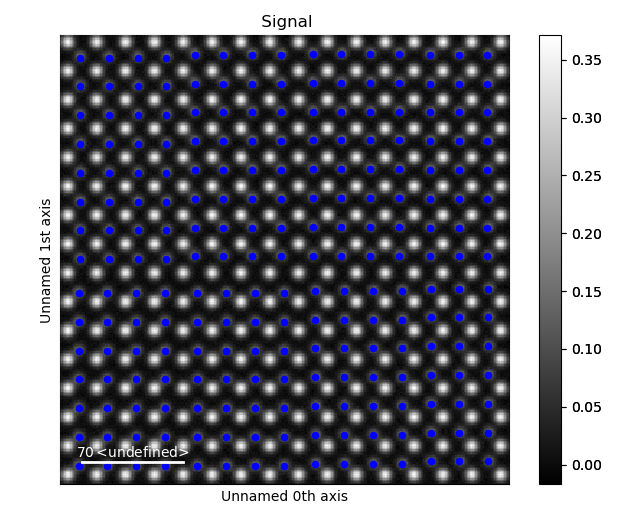
>>> from temul.dummy_data import get_polarisation_dummy_dataset
>>> atom_lattice = get_polarisation_dummy_dataset(image_noise=True)
>>> sublatticeA = atom_lattice.sublattice_list[0]
>>> sublatticeB = atom_lattice.sublattice_list[1]
>>> sublatticeA.construct_zone_axes()
>>> sublatticeB.construct_zone_axes()
>>> sampling = 0.1 # example of 0.1 nm/pix
>>> units = 'nm'
>>> sublatticeB.plot()
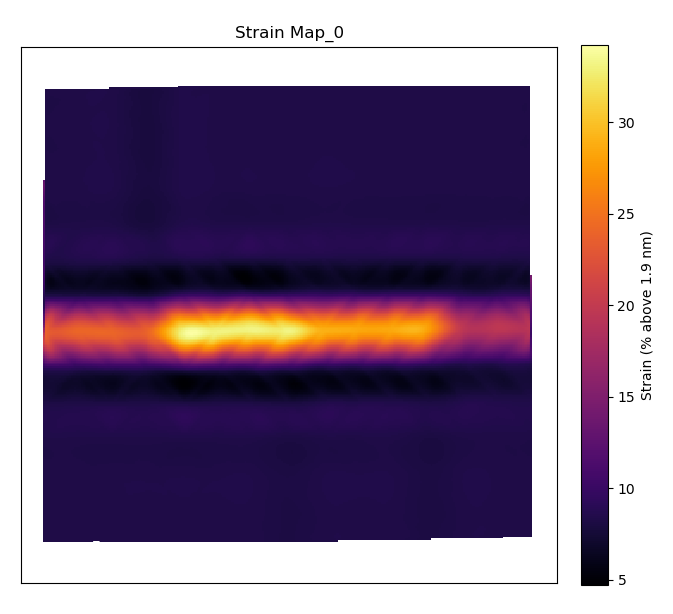
Plot the Lattice Strain Map
By inputting the calculated or theoretical atom plane separation distance as the
theoretical_value parameter in
temul.topotem.polarisation.get_strain_map() below,
we can plot a strain map. The distance l is calculated as the distance between
each atom plane in the given zone axis. More details on this can be found on the
Atomap
website.
>>> theor_val = 1.9
>>> strain_map = tml.get_strain_map(sublatticeB, zone_axis_index=0,
...            units=units, sampling=sampling, theoretical_value=theor_val)
The outputted strain_map is a Hyperspy Signal2D. To learn more what
can be done with Hyperspy, read their documentation!
Setting the filename parameter to any string will save the outputted plot
and the .hspy signal (Hyperspy’s hdf5 format). This applies to all structure maps
discussed in this tutorial.
Setting return_x_y_z=False will return the strain map along with the
x and y coordinates along with their corresponding strain values. One can then
use these values externally, e.g., create a matplotlib tricontour plot). This
applies to all structure maps discussed in this tutorial.
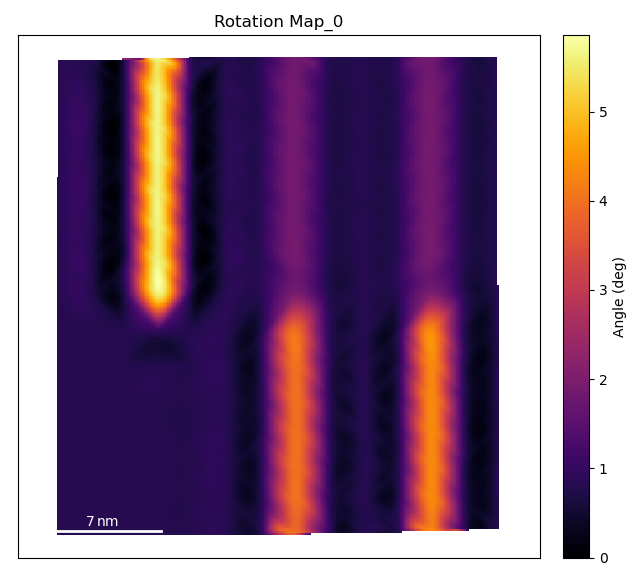
Plot the Lattice Atom Rotation Map
The temul.topotem.polarisation.rotation_of_atom_planes() function
calculates the angle between
successive atoms and the horizontal for all atoms in the given zone axis. See
Atomap
for other options.
>>> degrees=True
>>> rotation_map = tml.rotation_of_atom_planes(sublatticeB, 0,
... units=units, sampling=sampling, degrees=degrees)
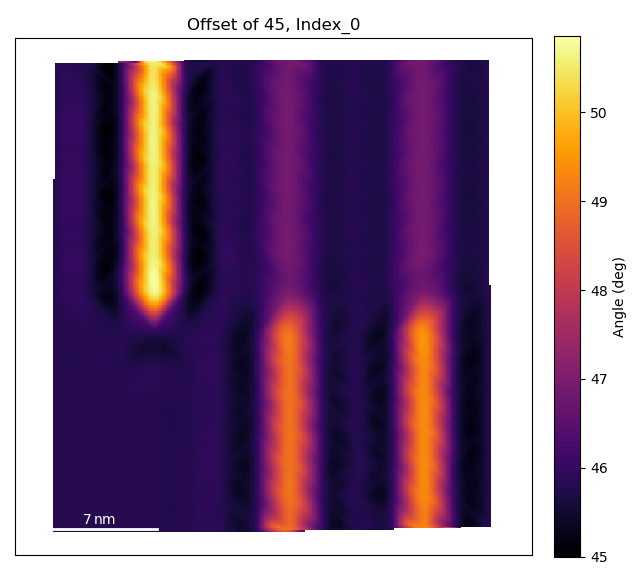
'''
Use `angle_offset` to effectively change the angle of the horizontal axis
when calculating angles. Useful when the zone is not perfectly on the horizontal.
'''
>>> angle_offset = 45
>>> rotation_map = tml.rotation_of_atom_planes(sublatticeB, 0,
... units=units, sampling=sampling, degrees=degrees,
... angle_offset=angle_offset, title='Offset of 45, Index')
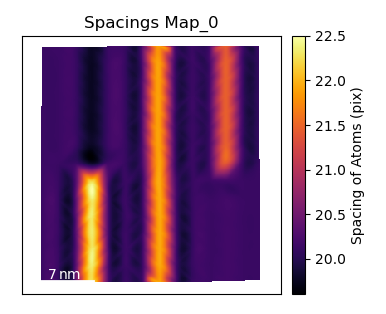
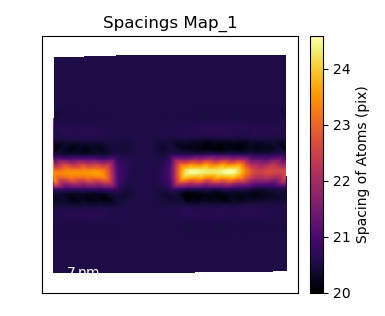
Plot the c/a Ratio
Using the temul.topotem.polarisation.ratio_of_lattice_spacings()
function, we can visualise the ratio of
two sublattice zone axes. Useful for plotting the c/a Ratio.
>>> ratio_map = tml.ratio_of_lattice_spacings(sublatticeB, 0, 1,
...                 units=units, sampling=sampling)
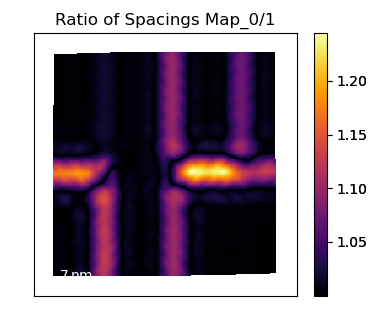
One can also use ideal_ratio_one=False to view the direction of tetragonality.